
Powerful and beautiful analytics built into Alma
Clarity brought to light
BeaconAI gives schools & districts clear, consistent views across the data they rely on most — so teams can align faster, prioritize with confidence, and make stronger decisions for every student.
 ► Attendance
 ► Enrollment
 ► Grading
 ► Family Engagement
 ► Incidents
Map your data.
Move from reporting to action.
BeaconAI is powerful and beautiful analytics built directly into Alma — so your team can clearly see what's coming for every student, not just what already happened.
Why BeaconAI
Built for educators, not analysts

Discover patterns
Clear visuals and familiar navigation help teams spend less time translating data and more time acting on it.

Connect the signals
See trends across attendance, behavior, grades, family engagement, enrollment, and assessments — unified in one place.

Sharpen your focus
Identify hidden issues before they compound, align your team on what matters, and act — while there's still time.
BeaconAI in action
Real dashboards. Real decisions.
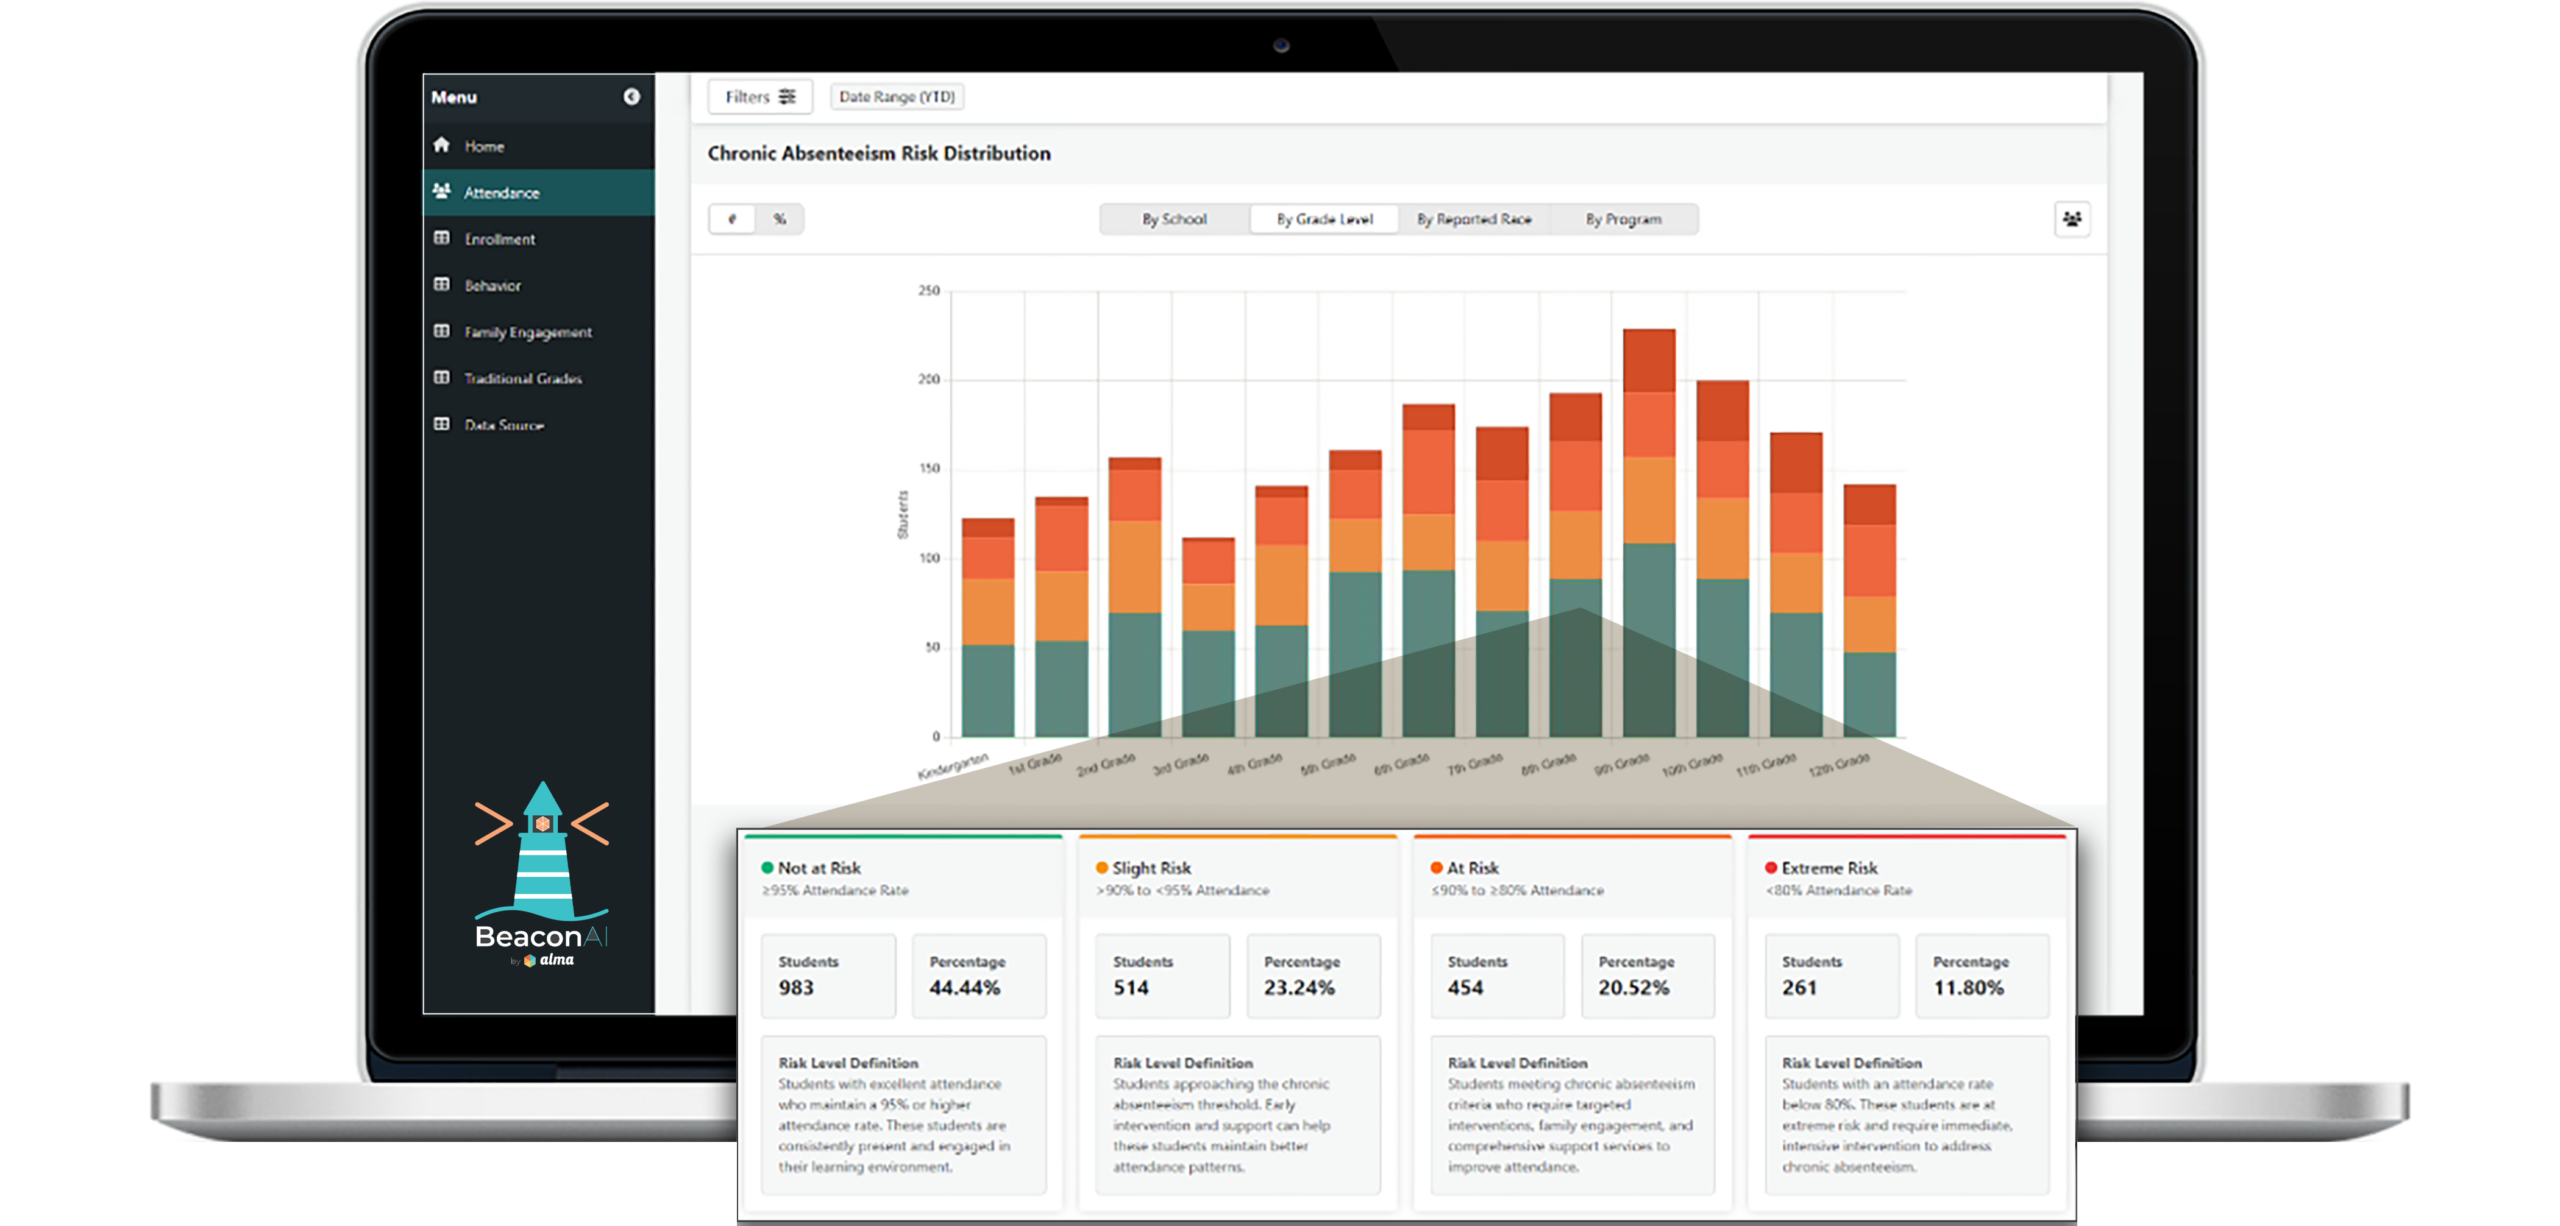
Identify early warning trends
Quickly highlight changes in attendance & truancy patterns, while there's still time to course correct.
- Where chronic risk is concentrating, by grade & school
- Emerging subgroup patterns & any equity gaps
- Submission consistency across sites & timelines
"Within a month, our ‘Not Taken’ rate dropped 87%. Before BeaconAI, we had no idea this issue existed."
— District Administrator

Pinpoint student population shifts
Gain visibility early, so staffing, support, & programs keep pace without guesswork.
- Side-by-side population comparisons at a glance
- Surfacing demographic changes & program variances
- Real-time support planning needs
"They approved four new positions on the spot. Before BeaconAI, this would have taken days. I had it in minutes."
— District Administrator
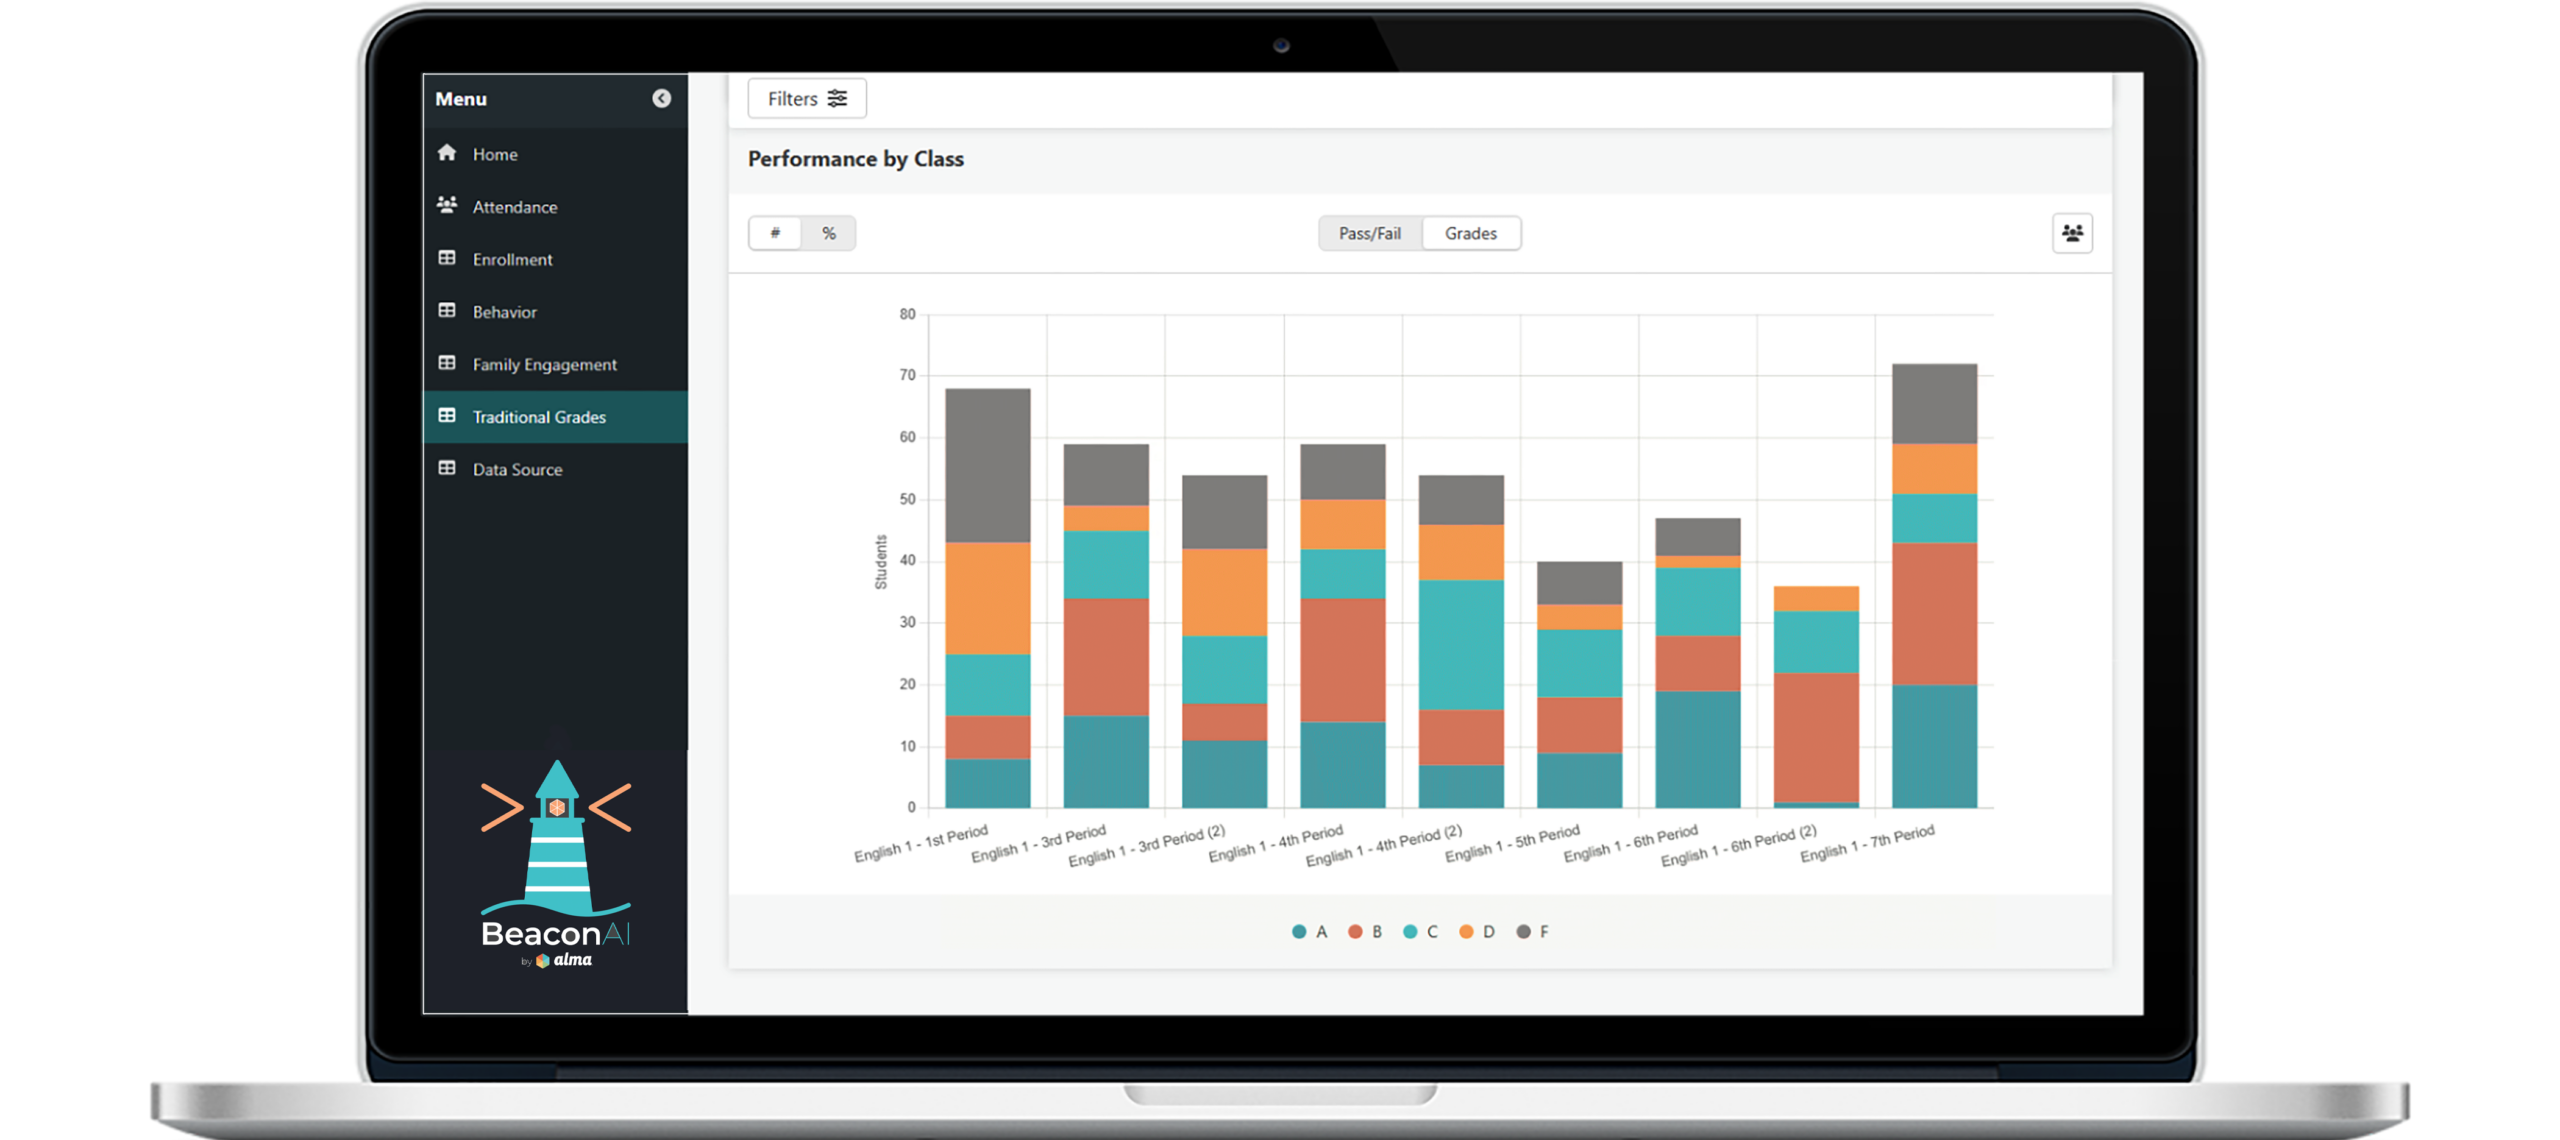
Discover performance patterns early
Surface any patterns as they form, so your team can respond before outcomes are impacted.
- Where outcomes are starting to spike or slide by course & grade
- Which bright spots are strongest & repeatable
- When gaps begin forming & who needs support first
"Our D and F rate dropped from 28% to 14%. Before BeaconAI, this would have taken hours. I had proof in seconds."
— Principal
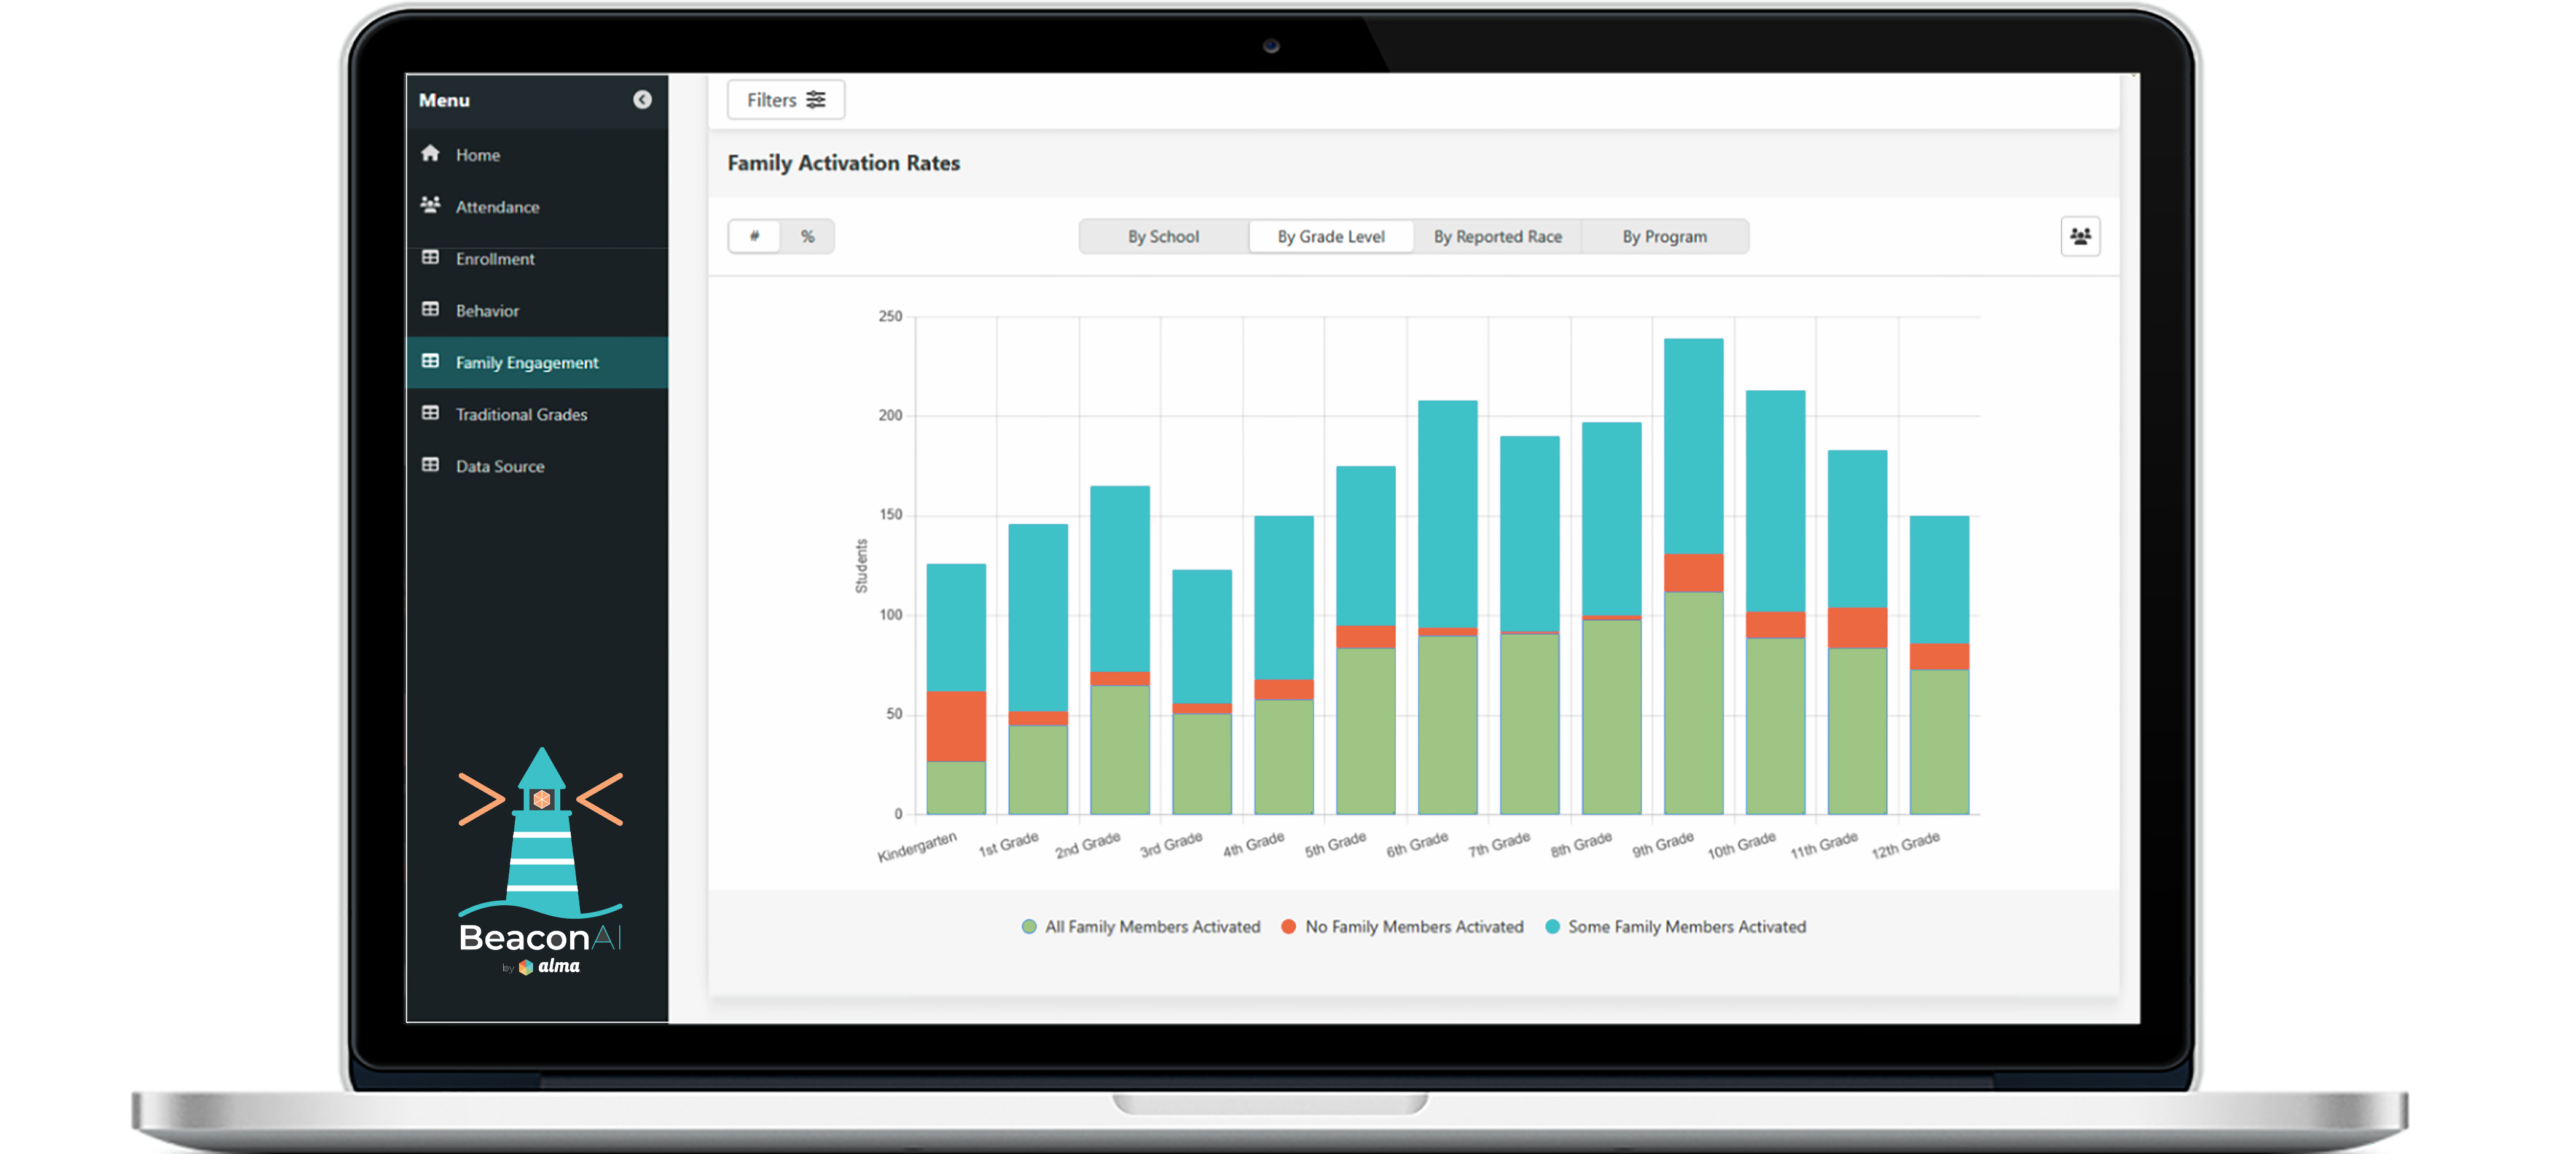
Confirm & affirm community involvement
See who is staying connected, who is drifting, & where a timely nudge can restart momentum.
- Activation rates vs. ongoing engagement over time
- Disengagement trends by grade level & school
- Any gaps by subgroup & program
"64% of our traditionally hard-to-reach families were active users without any training. In 15 years, I've never seen engagement like this."
— Principal
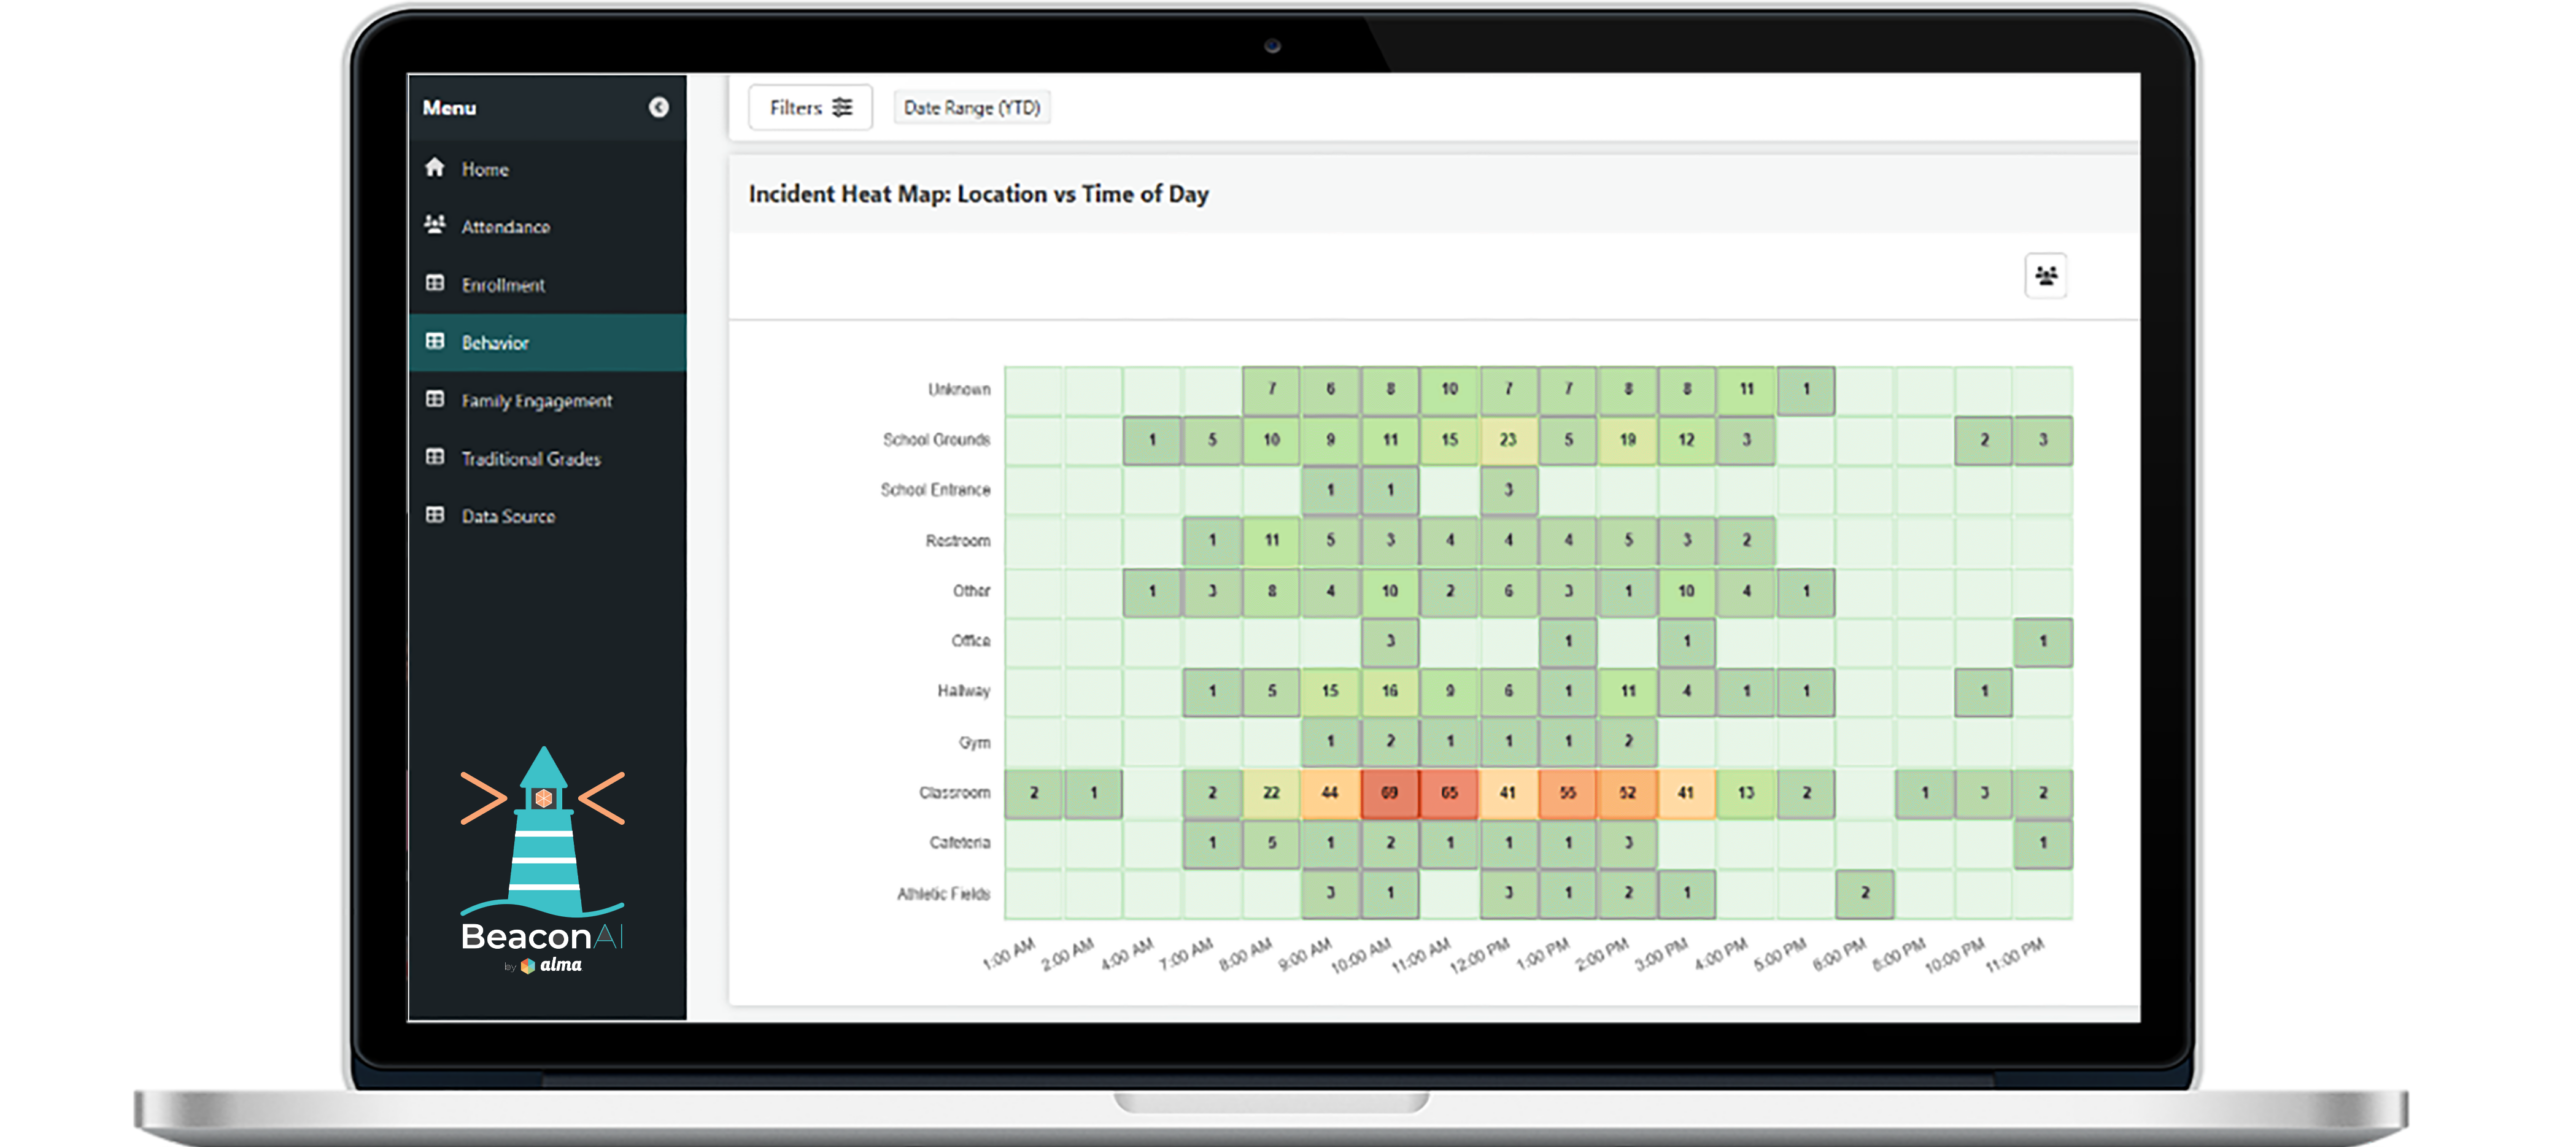
Transform behavior data into action
Quickly spot clear trends & hot spots, so you can respond before any spikes are repeated.
- Emerging trends by month, day, time, & location
- Comparisons across schools to spot patterns immediately
- Coding & logging inconsistencies that skew data
"Incidents dropped 65% in three weeks — solved in one planning period instead of weeks in spreadsheets."
— District Administrator
BeaconAI’s full coverage
Every signal that matters, now clearly visible
- Chronic absenteeism risk
- Submission consistency
- Truancy pattern shifts
- Incident hot spots
- Location & time heat maps
- Discipline coding gaps
- D/F rate trends
- Course-level performance
- Grade distribution shifts
- Pass/fail ratios
- Subgroup achievement gaps
- Bright spot identification
- Score distribution by grade
- Proficiency trend lines
- Program effectiveness
- Activation rates
- Disengagement by school
- Which families haven't activated yet
- Population shifts
- Demographic changes
- Program variances
- Subgroup growth patterns
- Equity gap signals
- Staffing alignment needs
- IEP & 504 tracking
- ESL/ELL trends
- Intervention timing signals
- Missing data flags
- Inconsistent coding
- Submission timeline gaps
- Cross-school comparisons
- Year-over-year trends
- Board-ready snapshots
- Resource allocation signals
- Staffing alignment
- Site-level benchmarks
Be so amazing that
people think you are a myth.
Ready to see BeaconAI in action?