
The benefit of using data
Working with data can uncover a wealth of information. If you or a team manipulate data and crunch numbers often to create reports, you understand it is a set of steps to achieve the desired output of a simple, digestible chart or table of information.
Bringing data from a piece of paper or from a table-structured spreadsheet to a more dynamic, visual representation can be a burden on staff to learn and maintain. Data visualization tools help quickly formulate the look and feel of the data to tell a story.
An example of a data visualization is a weather report. When you see it on the screen the structure of the chart is familiar and consistent, the temperature data updates frequently, and the weather icons help you make decisions on what to wear for the day. You are able to absorb the information quickly and consistently and can come back again and again. All of this information is helping you to prepare for the day and take action such as packing an umbrella in your bag.
Create plans with evidence
Collecting data is a time-consuming process. The time spent on recording and documenting student data should be used to drive better outcomes. Grade and progress reports are snapshots in time of learning and often only report out completion. These reports are generally one-dimensional and don’t show patterns or correlate with other academic aspects. If you often think about what we are doing with all this data then you are on the right track.
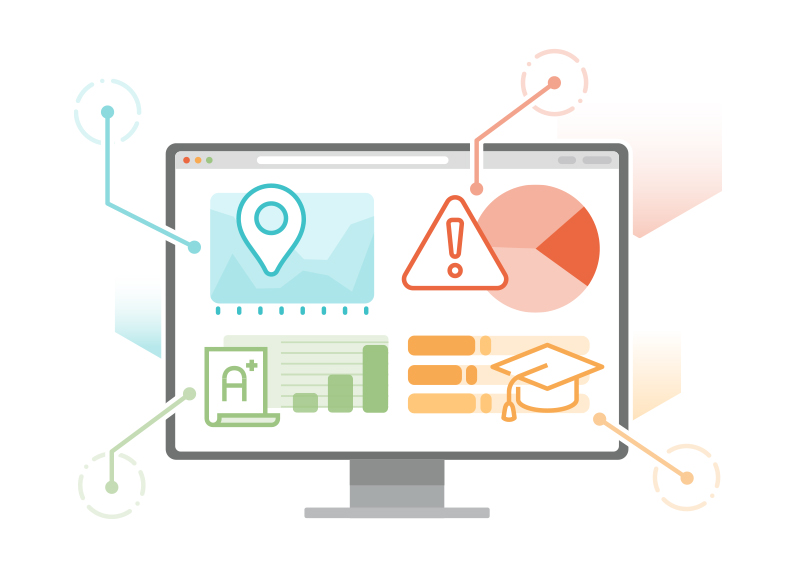
Alma’s Data Lab platform provides the information in visual form to answer those deeper educational questions. How many students are at risk due to attendance? How can we improve participation? Should we move resources to a specific academic area?
All of these questions lead to the formulation of plans to be put into action. Data visualizations provide a way to track decisions and allow for pivots to be made. Having consistent updates gives credibility and reliability in knowing you’re working from the same baseline.
Alma Data Lab is turnkey
To get started with Data Lab for Alma there is no extra work on your end. Your student data feeds the 26 data dashboards our team has pre-configured. Whether you have a data team or are just getting started, these dashboards are connected to the student data that is collected every minute during the school day through the Alma SIS platform. More importantly, they are providing an almost real-time look at the health and progress of the district, school, or student.
Behind the scenes, Alma leverages the Ed-Fi Data Standard to compile all types of data fields and translates it into a ‘common language’ that can be used by different applications like Data Lab.
The entire data cycle is a lot to understand. Sometimes you need to start in the middle to find out where you have been and where you are going with student data. Alma’s Data Lab gets you to the results faster and easier without the initial setup hassle.
Ready to learn more about Alma?